Building PgPule
Built PgPulse to learn Rust beyond tutorials, but it slowly turned into a deep dive into Postgres replication, WAL internals, RDS edge cases, async runtimes, TLS debugging, polling systems, and observability architecture while building a real-world monitoring service.

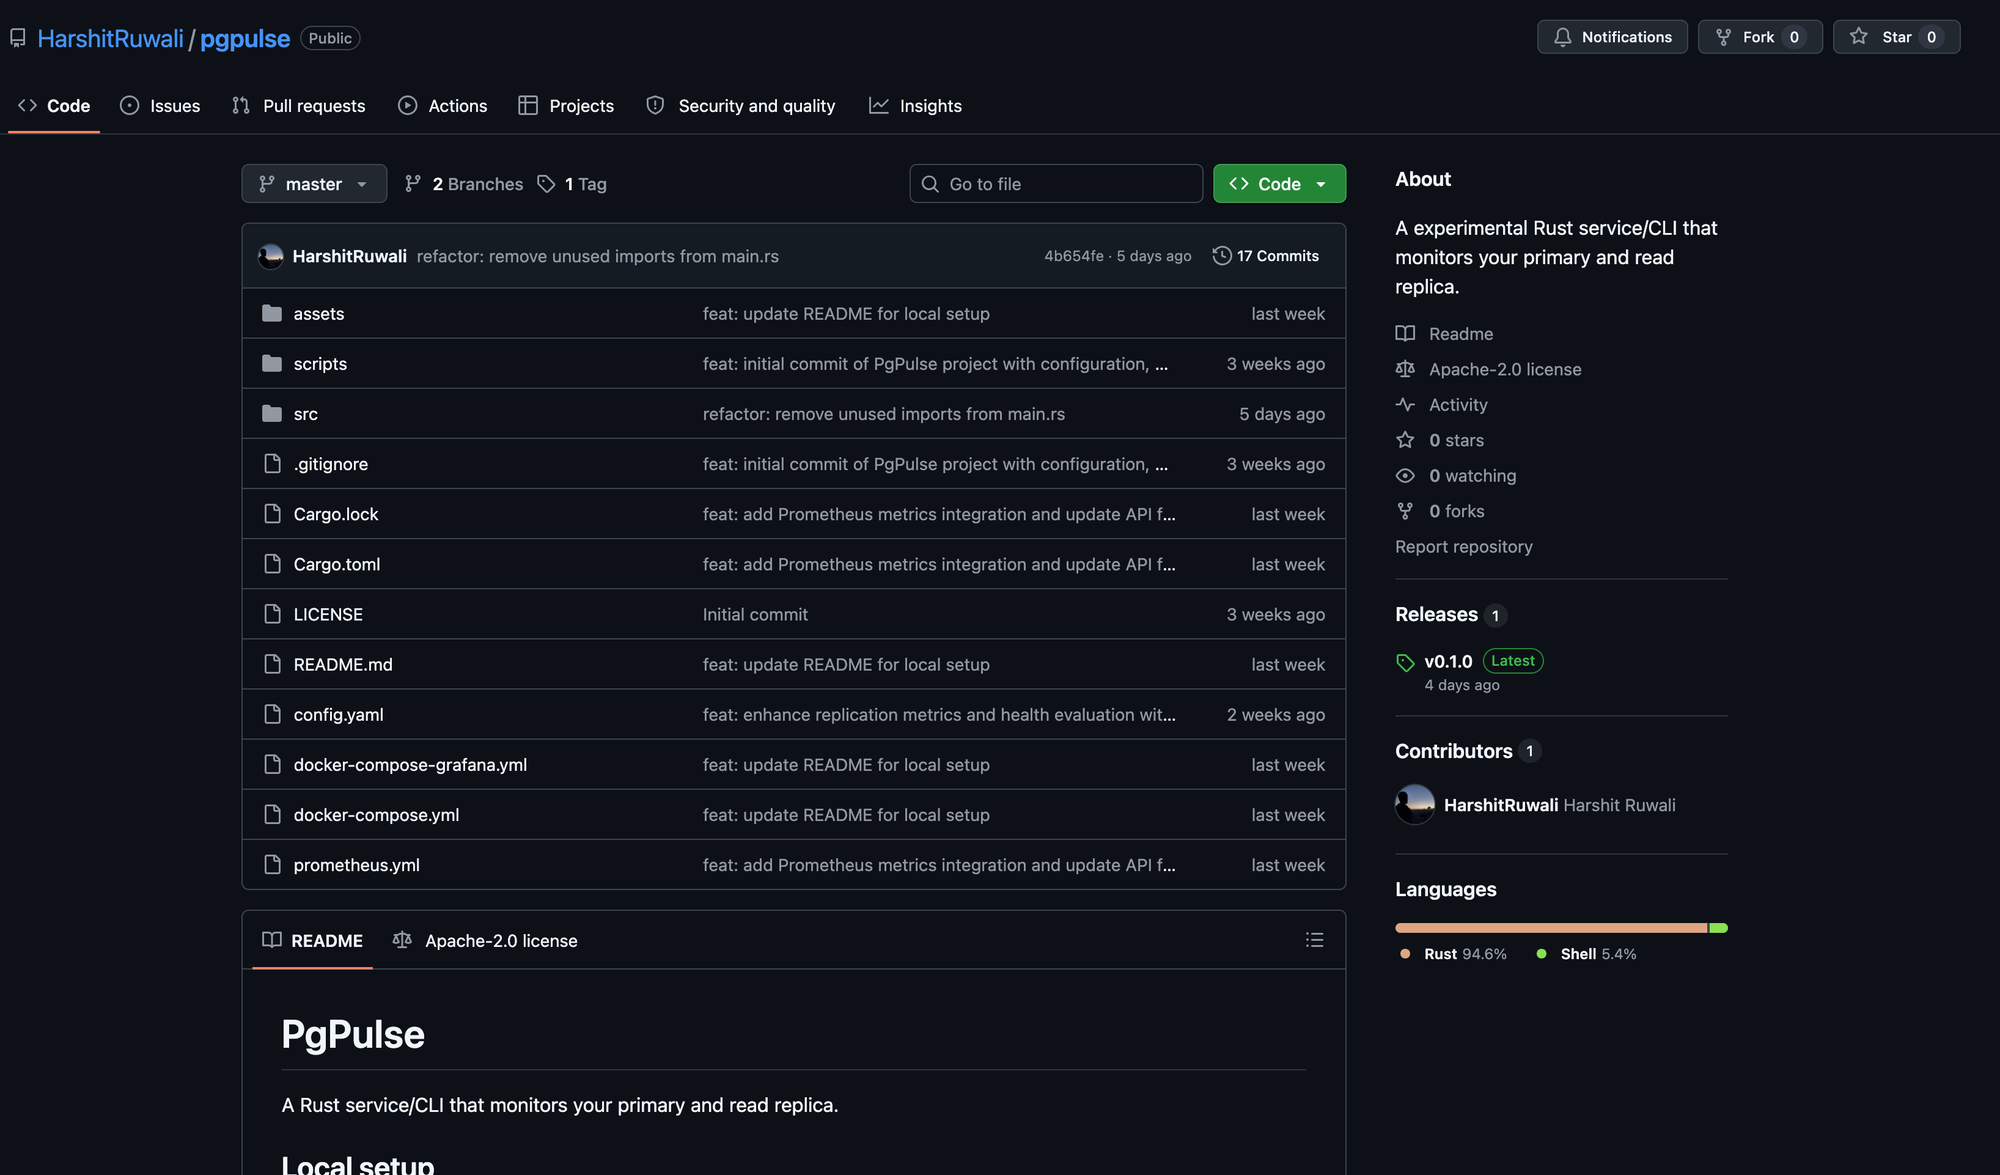
So recently I completed a Rust bootcamp I got from Let’s Get Rusty, and have some guided basic projects done in the way of the bootcamp. And by the end, I was kinda comfortable with the Rust basics at least, as I had some Rust projects done in past as well, a very basic one.
And so I embarked on a long journey of thinking about what to build. Initially, the thoughts that came to my mind were building a load balancer or reverse proxy or similar. But that seemed to be too common and out there. And it was on the networking side, so the learning curve to know the networking concepts themselves would take some time. So I dropped it after a few hours of thinking on that.
Then there was a data inconsistency reported by the data team in my office, due to replication delay in the RDS read-replica instance, and that was my eureka moment to finally build something actually meaningful, which I can later also use in the office if I keep it open source, which I meant to keep it.
And that embarked my journey of building PgPulse - A Rust service/CLI that monitors your primary and read replica.
Part 1 - Setup
I usually divide my project into smaller parts so as not to overwhelm with the complexity that the project might have kept hidden from me.
So phase 1 was very simple and straightforward, set up the repo and set up a local environment to replicate and have a master and read replica environment via Docker. And for configuring the compose files and replication, I just thank Claude Sonnet 4.6. And that was something I really outsourced, and I wasn’t focused on having the replication setup, but focused on the actual project. That took some time, but it was done. So now I had a demo environment ready with me.
Part 2 - DB connection & metrics
Now comes the real thing, the real building starts here. I have the DB replication working in here.
I started off by creating the basic structure of the project and all. Creating the models and the DB connection using tokio_postgres. And honestly, at this point, even small things like getting the DB connection to work felt like a win to me. Going through the blogs and documentation, avoiding AI to help on here wasn’t the goal.
If I wanted to code it up, I would just have done it in a day, but that wasn’t the goal. It was to build and to learn at the same time.
So now that I had DB connections established, I wrote the metrics collectors queries to fetch the replication stats. And wrote a function to evaluate health, which just checked the values of replay_lag_secondsIf the threshold exceeds a configured limit, it returns a warning/critical status.
And honestly, understanding what each and every metric actually means by itself could probably be a completely separate blog altogether. The WALs, replay positions, replication lag, and how differently things behave in sync vs async replication, that rabbit hole goes much deeper than I initially expected.
Part 3 - API & Polling
Now that I have the metrics and the DB status, it was time to return those back to the user, and thus wrote an API to expose the metrics and the status.
But there was this thing, I was getting the stale values once I had computed and stored the metric Models.
So I ended up writing a polling function to keep pulling the updated metrics and storing them. And that made me use Arc<RwLock<T>> it because the same metrics will be read by the API as well as the Polling service.
And that gave me a working API that returns the updated metrics.
Felt like it's almost completed, right? Things were working with the local DB setup that I had until I tested with the actual RDS instances.
Part 4 - RDS Reality Check
Testing with RDS - SSL Issue
As I changed the config and passed the RDS creds and ran the binary, the application crashed. Weird, right? And Rust trace gave me TLS issues.
And comes the major debugging. I used to hate any issues I encountered due to these SSL/TLS issues. Network issues in short.
So I went googling and scraping the internet, and I used TlsConnector from native_tls, but it is again giving an error, of invalid TLS and all. So I again embarked on the journey of debugging...
let connector = TlsConnector::builder()
    .build()?;
let connector = MakeTlsConnector::new(connector);

let conn_str = format!(
    "host={} port={} dbname={} user={} password={} sslmode=require",
    config.host, config.port, config.name, config.user, config.password
);
let (client, connection) = tokio_postgres::connect(conn_str.as_str(), connector).await?;
Post adding the TlsConnector block
I found solutions like you need to download the SSL cert from RDS and pass it while making the DB connection, and I was like, what? Sounds weird. I never had to do this with ayncpg in Python? I never did that, so why in rust? And I realised Python does all of these internally by itself.
And after about 30 mins of debugging, I found it somewhere in the blog that I needed to add a function object while building the TlsConnector.
let connector = TlsConnector::builder()
    .danger_accept_invalid_certs(true)
    .build()?;
let connector = MakeTlsConnector::new(connector);

let conn_str = format!(
    "host={} port={} dbname={} user={} password={} sslmode=require",
    config.host, config.port, config.name, config.user, config.password
);

let (client, connection) = tokio_postgres::connect(conn_str.as_str(), connector).await?;
Added the accept_invalid_certs function
And that being done, I was able to connect to RDS normally as I would do in Python, but just without this total overhead I had to face here in Rust.
Testing with RDS - Metrics issue
And now that I was having the metrics being collected from RDS, in spite of the replica being healthy, the status was returning Critical, and that made me go nuts. I was this close to completing the project, but another thing blew up, awesome.
So now I had to go deeper into the RDS and its replication working. And I stumbled hard on my face. And I had to rework the complete replication metrics, but this time, considering how PostgreSQL replication metrics behave differently on managed RDS environments.
Some of them are:
- pg_stat_replication returns 0 rows silently without rds_superuser.
- pg_last_xact_replay_timestamp() returns NULL when idle
- receive_lag_seconds is always NULL
-No reconnection logic after RDS failover/maintenance
- pg_last_wal_replay_lsn() returns NULL on the primary
And that was by far the most frustrating part of the project.
Part 5 - Slow query log
Fairly simple as I already had the complete structure implemented, so adding that wasn’t the hassle at all.
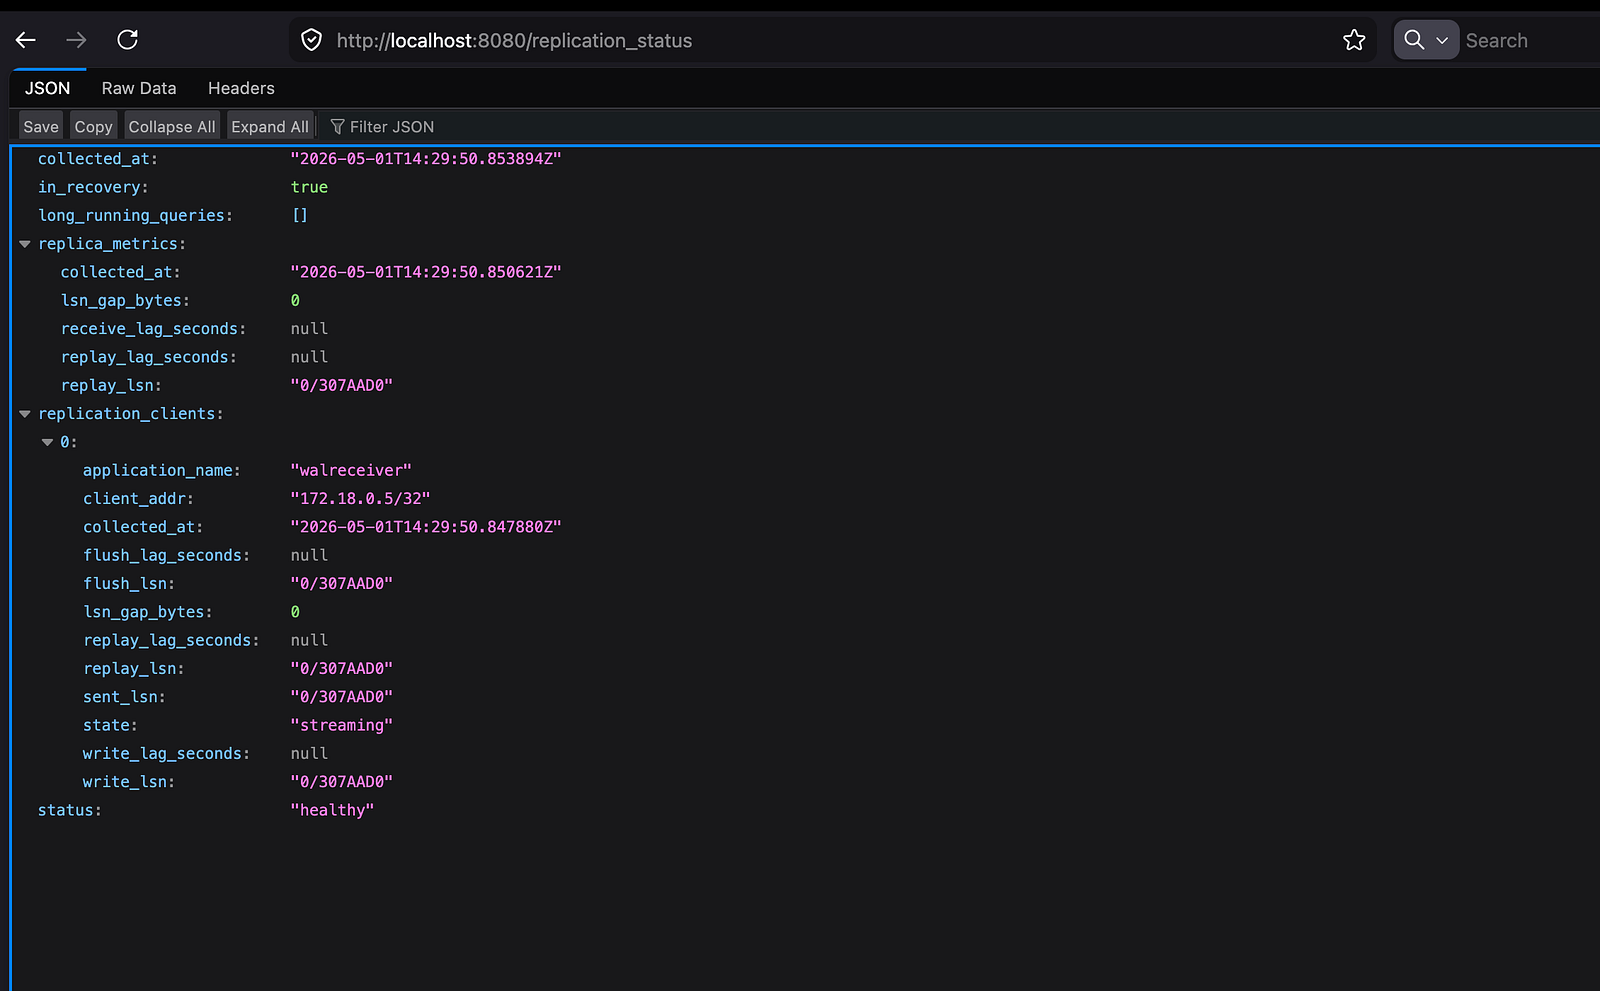
And finally, the API response looked like:
Part 6 - Prometheus
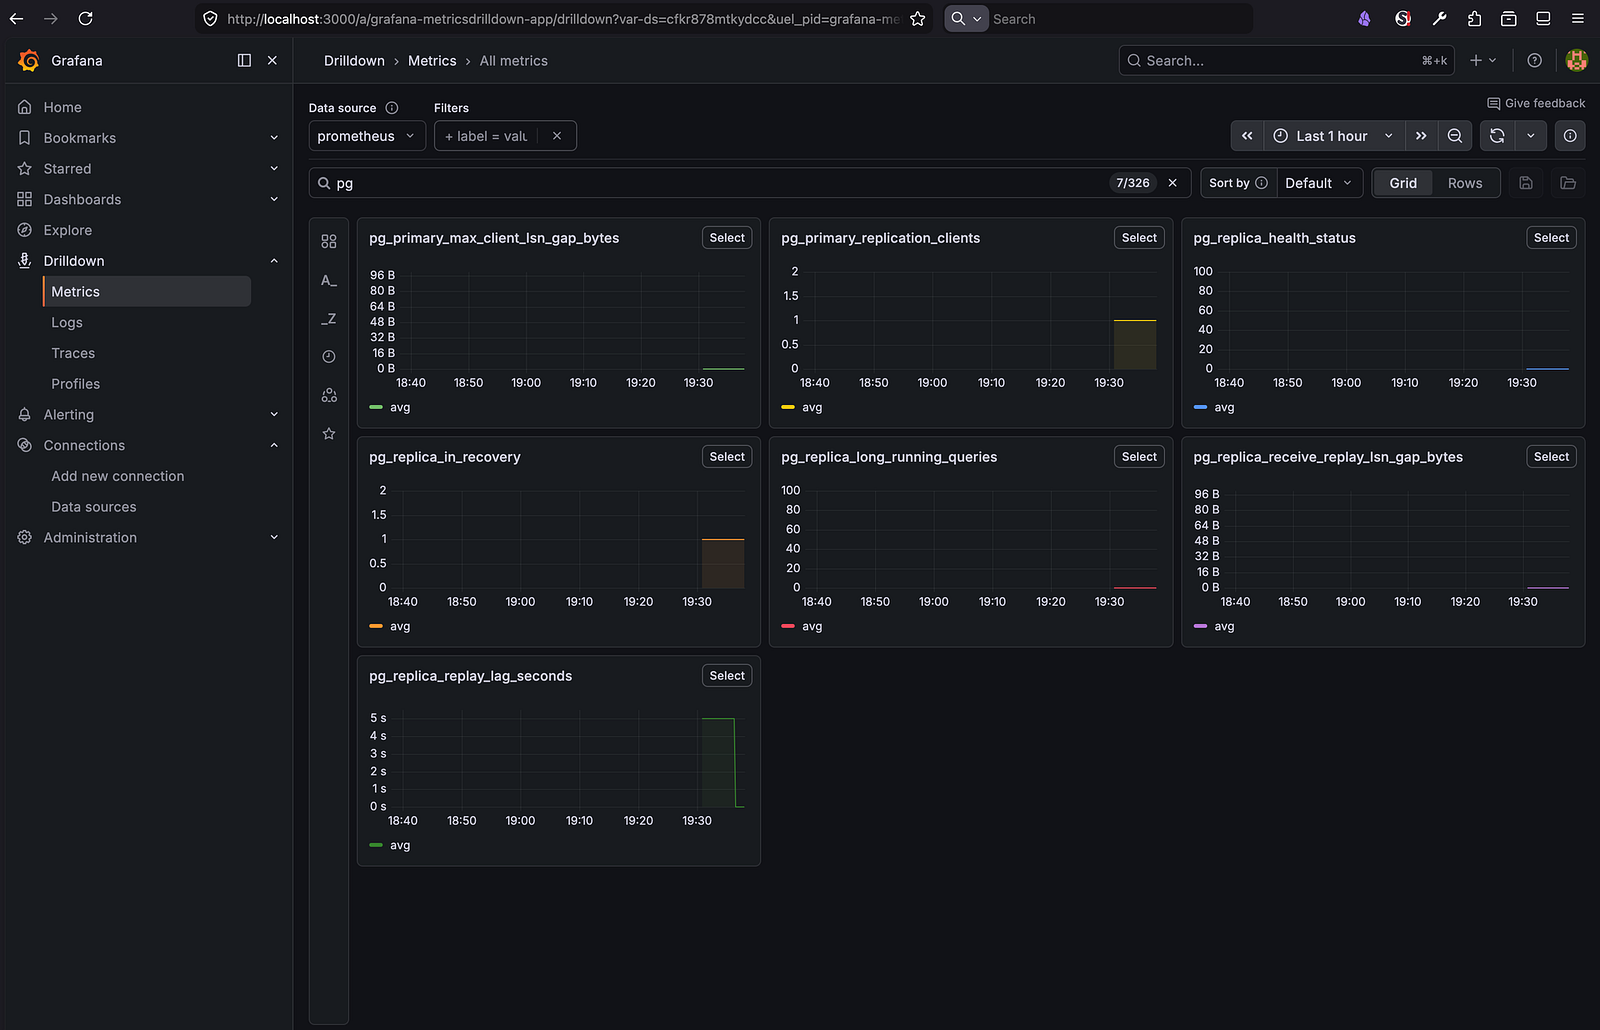
Now that I had the API being stable, I ended up exposing the metrics to Prometheus and showing it on Grafana.
And that wasn’t very straightforward, it took me a hard time getting things to work, and at the end I gave up and asked Sonnet 4.6 to help me out. lol
But that resulted in this:
And that concluded my PgPulse application. But did it?
While building this, I slowly realised polling Postgres externally only gets you so far.
The more I worked with WAL positions, replication internals, query activity and RDS edge cases, the more I started wondering, what if PgPulse could live inside Postgres itself?
Until next time, peace!