Everything Was Green: How My AI Assistant Lost Four Months of Memory Without Throwing a Single Error
A midnight health check on my self-hosted AI assistant turned up eight silently dead systems and a model layer that quietly ignored half of what I asked it. Every dashboard said healthy the whole time.

There's a scene in Silicon Valley where Richard, with absolutely nothing better to do, starts idly clicking through the usage numbers for PiperChat, Dinesh's video chat app, the one product at the company that's actually working. Everybody's celebrating. The growth curve is gorgeous. Dinesh is insufferable about it.
And then Richard, bored, looks slightly closer at the data and realises a huge chunk of the users are kids. Underage, and nobody had ever set up anything to check for it. The kind of number that turns into a per-user fine large enough to end the company. Their single biggest success was, on inspection, a catastrophe with beautiful metrics, and it had been that way the whole time. Nobody noticed because nobody had any reason to look. Everything was green.
I thought about that scene a lot the other night.
I was bored around midnight. Couldn't sleep, nothing on, so I figured I'd do a boring maintenance pass on my self-hosted AI assistant. Just a health check. Nothing planned, nothing suspected. I was that same guy with nothing better to do, poking at a system that had been quietly going unchecked for months, the same way that underage-user count had, just because nothing about it looked broken.
By half past two I'd found eight separate things that were completely dead, and not one of them had ever thrown an error.
Then I went looking at the model layer, and that turned out to be a whole second story: one where a 9B model beat a 27B by 60x, a fallback chain quietly refused to fall back, and my inference server cheerfully ignored what I asked it for.
This is all of it. It's long, because the interesting part isn't any single bug: it's how many different ways a system can be dead while every dashboard you own reports green.
The Setup
Quick context, because it matters for the failures.
It's a self-hosted multi-agent gateway: five agents, Matrix and Telegram as frontends, a pile of cron jobs. Inference runs on a llama.cpp box on my LAN. Long-term memory runs on Open Memory Stack, which is my own thing: PostgreSQL for structured metadata, Qdrant for vectors, Redis for cache/retry state, FastAPI as the boundary. It's open source, and it's the piece most of this post revolves around.
It's the assistant I actually use every day, not a weekend toy. Which is exactly why this stung. I built the thing to remember stuff for me and then, because it always looked fine, I stopped checking whether it did.
Everything Looked Successful
Here's what I saw when I started:
Config valid: ~/.openclaw/openclaw.json
Gateway service   systemd user installed · enabled · running
Memory            enabled (plugin memory-core)
Agents            5 · sessions 32 · default main active
Config valid. Service running. Memory enabled. Cool.
Then I ran the one command that makes a real call instead of reading config back at me:
openclaw memory status --deep --agent main
Provider: openai (requested: openai)
Indexed: 0/32 files · 0 chunks
Embeddings: unavailable
Embeddings error: openai embeddings failed: 429 {
  "error": { "message": "You exceeded your current quota...",
             "type": "insufficient_quota" } }
Zero chunks. Zero.
The key behind my embedding provider had been out of credit since roughly March. Every indexing attempt failed and gave up quietly. My assistant had been running with no semantic memory whatsoever for four months, and every dashboard said enabled and healthy.
Because it was enabled. That's the trap.
"Enabled" is a statement about configuration.
It says nothing about function.
The fix was switching embeddings to a provider whose auth actually worked (I already had GitHub Copilot auth sitting there) and reindexing. 0/32 files became 38/38 files, 80 chunks.
That's one dead thing, out of the eight. I assumed I was done. I wasn't.
The Second Memory Bug, Hiding Behind the First
Once indexing worked, I asked it something from my notes and got nothing useful back. Turns out memory search only indexes MEMORY.md and dated memory/*.md by default.
Everything else (USER.md, SOUL.md, my split-out topic files) wasn't indexed at all. Which is to say: the files containing my actual preferences, working style, and project context were invisible to the thing whose entire job was recalling my preferences, working style, and project context.
Fixed with an extraPaths config, but note the shape of it: I'd fixed the loud bug (dead provider) and there was a second, quieter one sitting directly behind it. One green checkmark is not the end of the investigation. Two down, invisible both times.
The Three Cron Jobs That Never Ran
If that was wrong, what else was?
Seven cron jobs, no red text. But three had a status I'd been filing as harmless:
status: skipped
last error: main job requires payload.kind="systemEvent"
consecutiveSkipped: 5
skipped. Not error. Not once had these three actually executed.
The bug was trivial: a main-session job needs one payload shape and these used another. It survived because skipped reads like "nothing to do this time" when it actually meant "structurally impossible to run, ever."
Your status vocabulary is an API. If "never executed" and "nothing to do" render identically, you've built a comfortable apartment for bugs to live in.
The Script Was a Lie Too
So I open the script those jobs were meant to run, ready to fix the payload shape:
async function syncJiraToDashboard() {
  console.log('🔄 Syncing Jira → DASHBOARD.md...');
  ...<snip>...
  console.log('✅ Sync complete (placeholder)');
}
Exit code 0. Green checkmark. Cheerful emoji.
Two independent layers of nothing-happening, stacked. The jobs couldn't run, and if they had, they'd have printed a checkmark and done nothing.
Best part: I tested the credentials out of curiosity and they were fine. HTTP 200, real issues came back. And my own memory file described this integration as "COMPLETE: bidirectional sync, 3x weekdays."
I had documented a feature that never existed. My notes were confidently lying to me about my own system, which is a special kind of unsettling. That's four, and the last one had a checkmark and an emoji.
A Pipeline With No Consumer
There's a nightly job that chunks my notes, embeds them, and pushes them into Qdrant. Working perfectly. Months of clean runs. Hundreds of chunks.
Then I went looking for the code that reads them back.
There isn't any. memory: {} in the config, no plugin querying the store, no code path that had ever retrieved a single vector. A write-only pipeline. Data went in every night and was never once read.
A pipeline with no consumer is a very elaborate way to write-protect a disk.
Five, and this one had been running clean for months, which is the part that bothers me.
38,590 Restarts
At this point I stopped trusting the app and dropped to journalctl:
● llama-schema-fixer.service - activating (auto-restart)
  Error: Cannot find module '/home/harshit/.openclaw/llama-schema-fixer.js'
  NRestarts=38590
Thirty-eight thousand, five hundred and ninety restarts.
Restart=always, RestartSec=5. Every five seconds, for weeks. And there were two of them, both at the same count.
One (fastapi-memory.service) pointed at a directory that no longer existed: a leftover from before I containerised Open Memory Stack; the real service had been happily running in Docker the whole time. The other tried to run a script that had never been written.
Remember the name of that second one. llama-schema-fixer. It comes back.
Neither appeared in my app's health tooling. Why would they? They're plain systemd user units, outside the application's model of the world. Your monitoring covers the parts of your system your monitoring knows about, which sounds like a tautology right up until it's been melting a core since spring.
If you take one command from this post: systemctl --user list-units --failed, then grep journalctl for restart counts. Mine had been screaming into a log nobody read.
Six and seven: two ghost services, crashlooping into a log nobody read.
The Embedder Was Quietly Eating My Data
Once memory actually worked, I noticed 490 of 499 chunks from one transcript had stored. Nine missing. HTTP 502, chunk gone.
The cause is genuinely interesting. The limit isn't characters, it's tokens, and dense content tokenizes far worse per character than prose:
| Input | Chars | Result |
|---|---|---|
| Normal prose | 2000 | OK |
| Single unbroken string | 2000 | 502 |
| Real OAuth URL | 955 | 502 |
| Same URL, cut to 900 | 900 | OK |
Same URL. 55 characters shorter. Works.
My chunker split on newlines: fine, until someone pastes a JSON blob or a giant OAuth URL containing no newlines at all, which sails past every limit I thought I'd set. Those chunks came out at 2254 characters.
Fix: cap chunks at 800 chars, break any unbroken run over 250, and add an adaptive halving retry for anything still too dense. Before: 490/499 chunks stored, 9 permanently lost. After: 1006/1006, zero lost.
There's a subtlety worth calling out. Before I found the real cause, I'd added a "97% success" tolerance so the sync would stop retrying forever. That was the right call operationally: without it, one stubborn transcript re-uploaded ~490 chunks every single night. But it also meant I'd built something that accepted permanent data loss as normal and moved on. Tolerating a failure and fixing it are different things, and it's very easy to ship the first while telling yourself you did the second.
The service doesn't truncate oversized input. It drops it and returns an error I wasn't checking. Partial success looked exactly like success, because I was counting what I sent, not what I stored.
Eight. That's the whole list from the memory side, and every single one of them had been reporting healthy right up until I checked.
Now, The Model Layer
That's the silent-failure half. The model half was worse, mostly because I had opinions going in.
My local box runs one model at a time via llama.cpp. I'd picked qwen3.6-27b as primary: biggest thing that fit, obviously the best choice. Alongside it, two paid paths as fallback: Claude Sonnet 4.6 via GitHub Copilot, and Claude Sonnet 5 through the Claude Code CLI. That second one routed expensive work through my subscription instead of the API. I verified end to end that nothing could quietly slip onto metered billing instead.
The plan was sensible: run everything locally for free, escalate to the paid paths when local can't cope. That is not what happened.
The Model That Couldn't Fall Back
First thing I hit running qwen with tools:
400 Unable to generate parser for this template.
Automatic parser generation failed: JSON schema conversion failed:
Pattern must start with '^' and end with '$'
llama.cpp builds a grammar from tool schemas, and its regex converter demands every pattern be fully anchored. Several of mine weren't, so the whole call got rejected, not the offending tool, all of it.
Fine, I thought. That's what the fallback chain is for.
It isn't:
decision=surface_error reason=format
from=ai-vm/qwen3.6-27b next=none
next=none. The fallback chain doesn't cover format errors. It rescues availability and auth failures: provider down, token expired, but a schema rejection is classed as your bug, not the provider's, so it surfaces immediately and the chain never engages.
That's a defensible design decision. It's also one I'd assumed my way straight past. I had three models configured and genuinely believed that meant three chances. It meant three chances at some failures.
And here's where the ghost comes back: llama-schema-fixer (the service crashlooping 38,590 times against a script that didn't exist) was a reverse proxy meant to rewrite exactly these unanchored patterns before they reached llama.cpp. Past me hit this same bug, designed the fix, wrote the systemd unit… and never wrote the proxy. The fix existed only as a service definition, failing every five seconds, for weeks.
I did eventually write it. Then deleted it, because by then I'd stopped needing it.
Building a Router That Was Too Slow to Route
The other qwen problem was speed. A turn chaining a few tool calls (search memory, read a file, answer) ran over fifteen minutes before I killed it.
So I wrote a routing policy: keep cheap conversational work on the free local model, hand anything multi-step or latency-sensitive to Sonnet 5 on the subscription, and have it report back so the local agent stays the one talking to me. Free by default, fast when it matters. Sensible.
Then I tested it, and it timed out.
Not the delegated task: the decision to delegate. Evaluating the routing policy is itself a tool call, and qwen was too slow to finish deciding it should hand off before the turn died.
A router that can't run fast enough to route is just an outage with extra steps. If you're building an escape hatch for slowness, the hatch has to be faster than the thing it's escaping.
Going Smaller Made It Faster
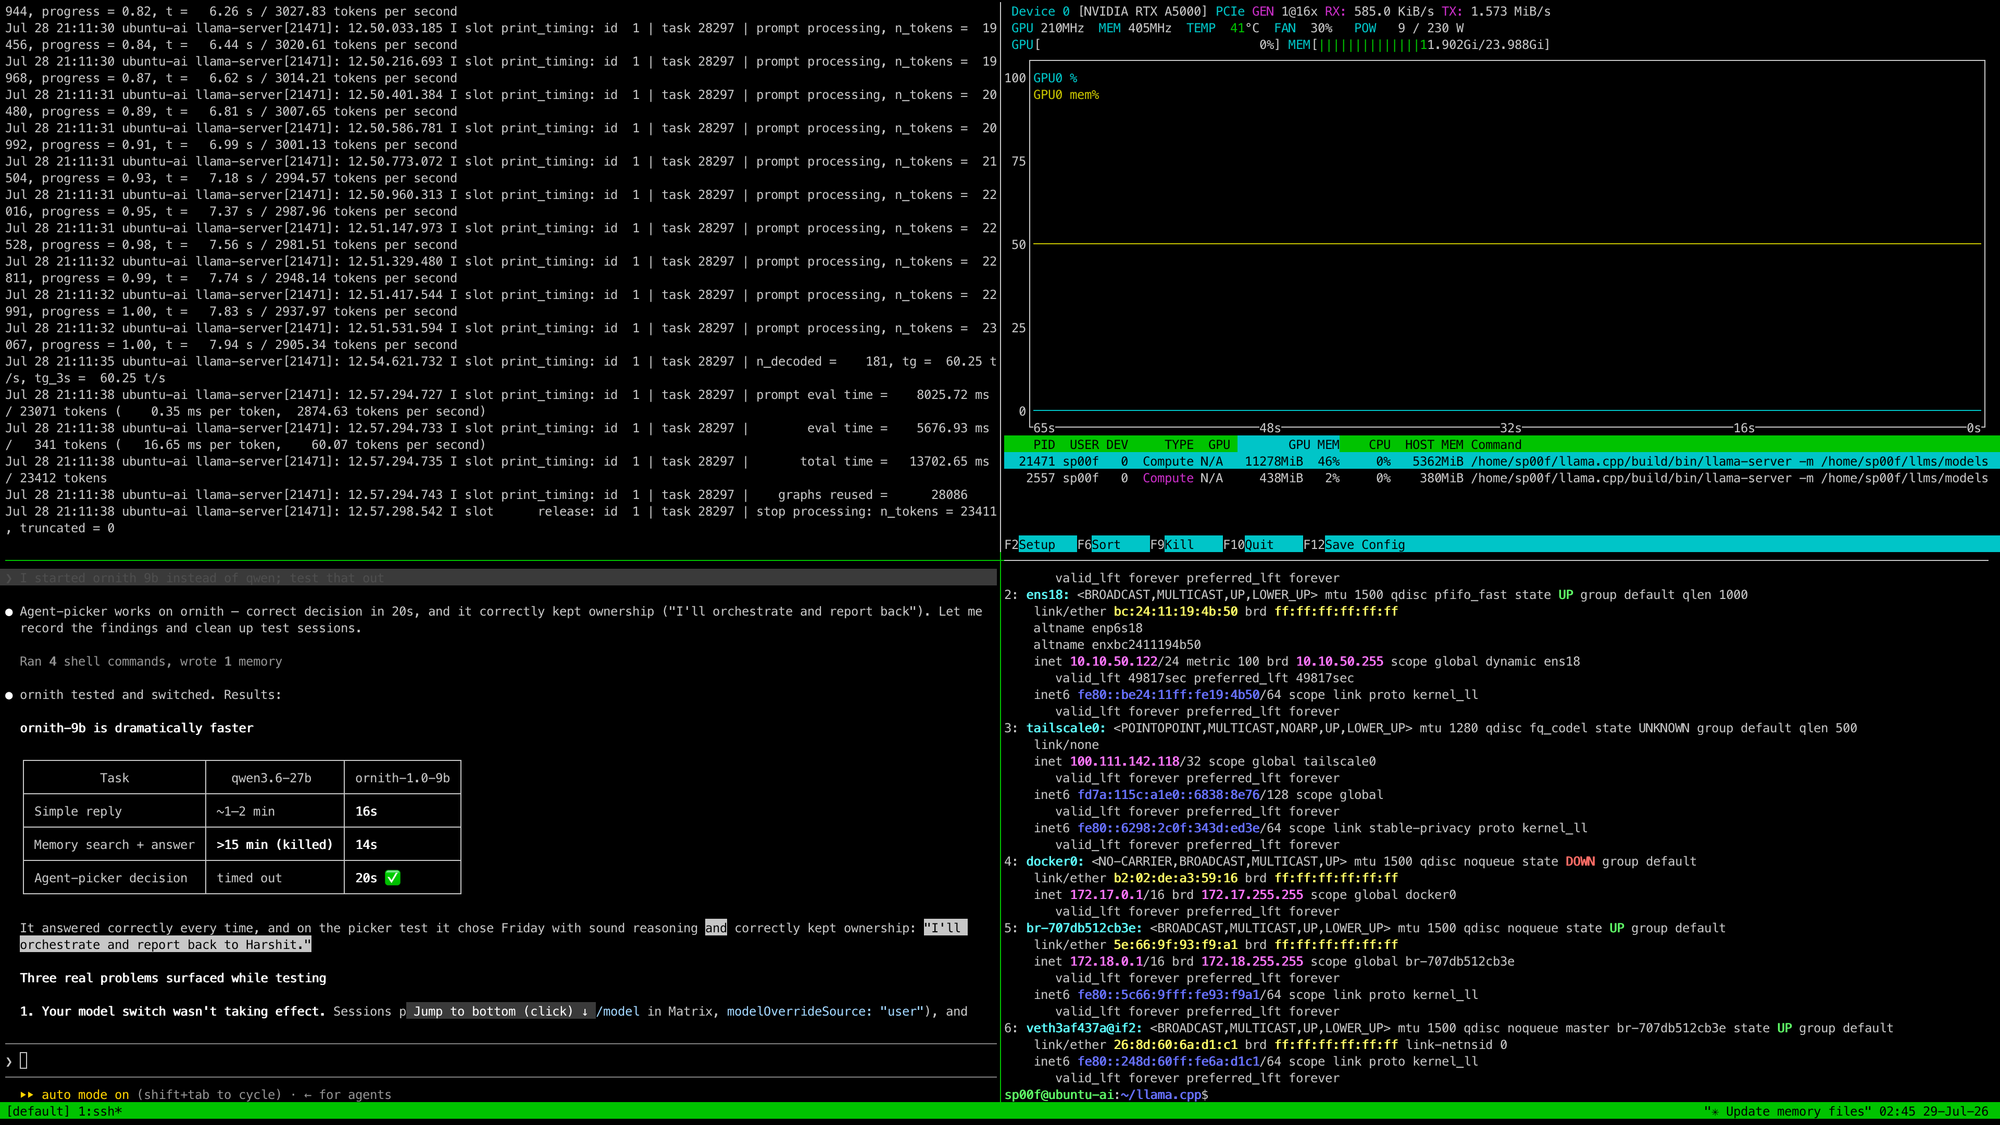
Then I swapped the local model to ornith-1.0-9b (a third the parameters), expecting to trade quality for speed.
Same questions, same correct answers. Roughly 60x on the task that mattered most. The routing decision qwen couldn't finish, ornith made in twenty seconds, with sound reasoning about why it should delegate, and correctly noting it would report back rather than hand the conversation over.
One gotcha: ornith is a reasoning model. It fills reasoning_content first and content last, so with a small max_tokens you get an empty content and finish_reason: length. My first test looked like a broken model. It was thinking, and I'd cut it off mid-thought.
Oh, and the Server Ignores You
While swapping models I noticed the config still said qwen3.6-27b and requests were still succeeding. HTTP 200, real responses.
llama.cpp serves whatever model is currently loaded and ignores the model field in your request entirely. Ask for a model that isn't loaded and you don't get an error, you get 200 and completely different weights.
There is no wrong-model failure mode. There's only a wrong answer that looks exactly like a right one.
Related: sessions pin their own modelOverride, set months ago from a /model command in chat, and that pin survives config edits and full gateway restarts. Ten sessions were holding stale ones. I "switched models" three separate times before noticing nothing had actually changed.
It Wasn't Even the Model
I want to include this because leaving it out would be dishonest.
I had a clean story now: big model slow, small model fast, table to prove it. I nearly shipped it.
Then I ran the same prompt on the same model twice: once on a fresh session, once on my main one:
| Session | Context carried | Time |
|---|---|---|
| Fresh, throwaway session key | ~0 tokens | 16s |
Main session (agent:main:main) |
58k tokens (44% of window) | timed out, >115s |
Same model. Same prompt. Individual model calls were fast throughout, 0.75 to 6 seconds each. Lots of fast calls but a slow turn points at context and orchestration, not the model.
So a real chunk of what I'd confidently diagnosed as "the 27B is too slow" was my own session bloat. The model swap was still worth it. But I'd built an entire delegation architecture on a conclusion I hadn't isolated, and one control, a throwaway session key, cut the finding in half.
Annoyingly, sessions compact refused to help: it reports "No compaction needed" below its internal threshold, even at 44% context. You have to force it with --max-lines, or just start clean.
What I Actually Built Out of All This
Fixing the bugs was maybe half the work. The rest was making the memory system something I'd actually trust.
Two-tier recall. Tier 1 is the local index: fast, curated, recent. Tier 2 is Qdrant via Open Memory Stack: older material and full conversation history. The rule is: recent goes to Tier 1, anything older or "what did we actually decide" goes to Tier 2. Before this, Tier 2 was unreadable: the write-only pipeline from earlier. Now there's an actual retrieval path.
Conversation threads, synced. Tier 1 indexes notes; it has never indexed what was said. So I added transcript syncing across all five agents: 628 chunks from 25 transcripts on the backfill, incremental by mtime afterwards, so a nightly run re-uploads only what changed. Steady state is zero.
A regression I caused myself. Threads outnumber curated notes roughly 6:1. The moment I added them, a single blended query let threads bury the older daily notes completely: I'd made retrieval worse while adding data. Fixed by querying each bucket separately and merging, so documents and conversations both surface.
Data I'd already lost. Tier 2 turned out to hold notes that no longer exist on disk at all: files under an old home directory from a machine migration, including a USER.md section from June with preferences I'd written down and since deleted. I restored them. That's the actual payoff of an archive: not search, but the stuff you didn't know was gone.
Search before you ask. A standing rule, written into every agent: check Tier 1, then Tier 2, then conversation threads, and only ask me if all three come up empty, stating what was already checked. The whole point of building memory is not being asked the same thing twice.
Housekeeping. 37 files and 2.2MB of .migrated / .deleted / .reset cruft trashed, 14 orphaned transcripts cleared, a legacy cache removed, and a cron job fixed whose delivery had broken the moment I added a second chat channel: it was configured to deliver to "the last channel used," which stopped being unambiguous and started failing closed.
And a parity check, because I'd just learned this lesson the hard way: a file indexed in Tier 1 but missing from Tier 2's sync list is invisible to half the system. It had already happened once. Now the two lists get compared.
One AI Debugging Another
There's one thing I haven't mentioned yet.
Nearly all of this investigation was Claude Code working through my box, an AI agent auditing a different AI agent's brain, finding out it had amnesia, and then writing the fix into the amnesiac's own instruction files. I'm aware of how that sounds.
Make of that what you will. I have thoughts, and they're below.
What it was genuinely good at was the boring, systematic part I'd been avoiding for four months. It didn't accept a single green status line. Every time something reported healthy it went and checked the artifact: is the index non-empty, did the job actually execute, does anything read this. That's not clever. It's just tedious, and tedium is exactly what I skip when I'm the one maintaining my own stuff.
The 38,590 restarts are a good example. Those were found by dropping out of the application's tooling entirely and reading journalctl, a thing I could have done any day for months and never did, because the app kept telling me it was fine and I had no reason to doubt it.
It also caught its own mistakes, which I didn't expect. When it added conversation threads to the memory archive, it noticed that threads now outnumbered notes six to one and were burying the older daily notes in search results (a regression it had just introduced) and flagged it before I saw it. Same with the model benchmark: it had a clean story about the 27B being slow, then ran a control on a fresh session and told me half its own conclusion was wrong.
Where it needed me was the judgement. It wrote a whole reverse proxy to work around the llama.cpp schema bug; I told it to delete the thing entirely because I'd rather not carry a proxy I'd forget about, which is, after all, exactly how the original ghost service happened. It wanted to keep chasing the Jira sync; I said that's on hold, leave it. It kept treating the local model's slowness as a problem to solve; I said that's fine, it's free, I'll swap to Sonnet when I care about speed.
And it is not immune to stupidity. At one point it ran a pkill to clean up stray processes, and the pattern matched the shell it was running in. It killed itself. Twice.
The honest summary: it was a very good, very fast pair of hands with no ego about being wrong, and roughly zero instinct for which problems were worth solving. The debugging was better than mine. The prioritisation was not.
Lessons Learned
- Check the data path, not the control plane. "Is it configured?" is the wrong question. "Is the index non-empty? Did the query return rows? Did the job execute?" is the right one.
- Treat quiet statuses as suspicious.
skipped,0 results,no changes, empty output. Loud failures get fixed the same day. Quiet ones ship and stay for four months. - Know what your fallback chain actually covers. Mine handled availability and auth, not schema rejection. Three configured models did not mean three chances, and I never checked which failure classes triggered failover until one didn't.
- Bigger is not faster, and often not better. A 9B beat a 27B by 60x on real work with no quality loss I could measure. Benchmark your workload, not parameter counts.
- Count both sides. Sent vs. stored. Enqueued vs. executed. Written vs. read. Nearly every bug here dies instantly if you compare two numbers instead of one.
- Tolerating a failure isn't fixing it. My 97% success threshold was operationally correct and quietly normalised permanent data loss.
- Look outside your own abstraction. My
doctorcommand is great at diagnosing the app and structurally blind to two systemd units melting a core beside it. - Isolate before you conclude. Especially when the numbers already agree with you.
Final Thoughts
The memory one still bothers me most.
I wrote the notes. I built the pipeline. I checked the status. And for four months the system I built specifically to remember things for me remembered nothing, and told me it was fine, which is worse than being obviously broken, because I stopped asking.
When retrieval finally came back up, the first thing it surfaced was that set of preferences I'd written in June and lost off disk entirely. One of them said I prefer full explanations over quick triage.
The note describing how I like things explained had been sitting for four months in a store that nothing on earth could read. It took a second AI to go and dig it out of a vector database so the first one could finally know how I like being talked to.
The thing about that Richard scene is that nothing failed. No alert fired, no service fell over, no customer complained. The numbers were great. The catastrophe was fully formed and sitting in plain sight the entire time, and it took someone with no particular agenda, at an hour when nobody should be looking at anything, to actually look at it.
That's the part worth stealing. Not "monitor more": I had monitoring. Every one of these systems was being watched by something that reported it healthy. The fix is occasionally being the bored person at midnight who opens the data itself and checks whether the story it tells matches the story on the dashboard.
Four months of silent failure, and the thing that finally caught it was insomnia.
Every single failure in this post had monitoring. None of them had validation.
Green dashboards are a claim, not a proof. Go check the data.
And if this saves someone else from discovering their vector store has been write-only since March, or from assuming a fallback chain has their back when it doesn't, I'd call that a success.